Data-driven lab and field testing of compact flexible printed circuit (FPC) antennas tuned for the 902–928 MHz ISM band show realized gain typically between −1 and +3 dBi, measured total efficiency spanning roughly 40–80%, and return-loss/VSWR targets often better than −6 dB / 2:1 across the tuned band. This 902-928 MHz FPC antenna overview sets empirical benchmarks and previews a full performance report to follow.
Typical test campaigns combine anechoic-range S11 and far-field gain mapping with over‑the‑air RSSI sweeps and controlled link‑budget trials. Measured variability is dominated by mounting and ground plane interaction; documenting those conditions yields reproducible results and actionable optimization steps for deployment and verification.
1 — Background: 902–928 MHz Context & FPC Antenna Basics
Regulatory & Application Context
Point: The 902–928 MHz ISM band supports LoRaWAN, LPWAN nodes, RFID, and other IoT devices under US FCC Part 15 power and spurious-emission limits.
Evidence: Typical transmit power caps (up to 30 dBm conducted for FHSS) and required spectral masks tightly constrain RF link budgets.
Explanation: A practical performance report must list regulatory operating limits, expected device sensitivity, and how those constraints influence antenna gain and efficiency tradeoffs for compliant range targets.
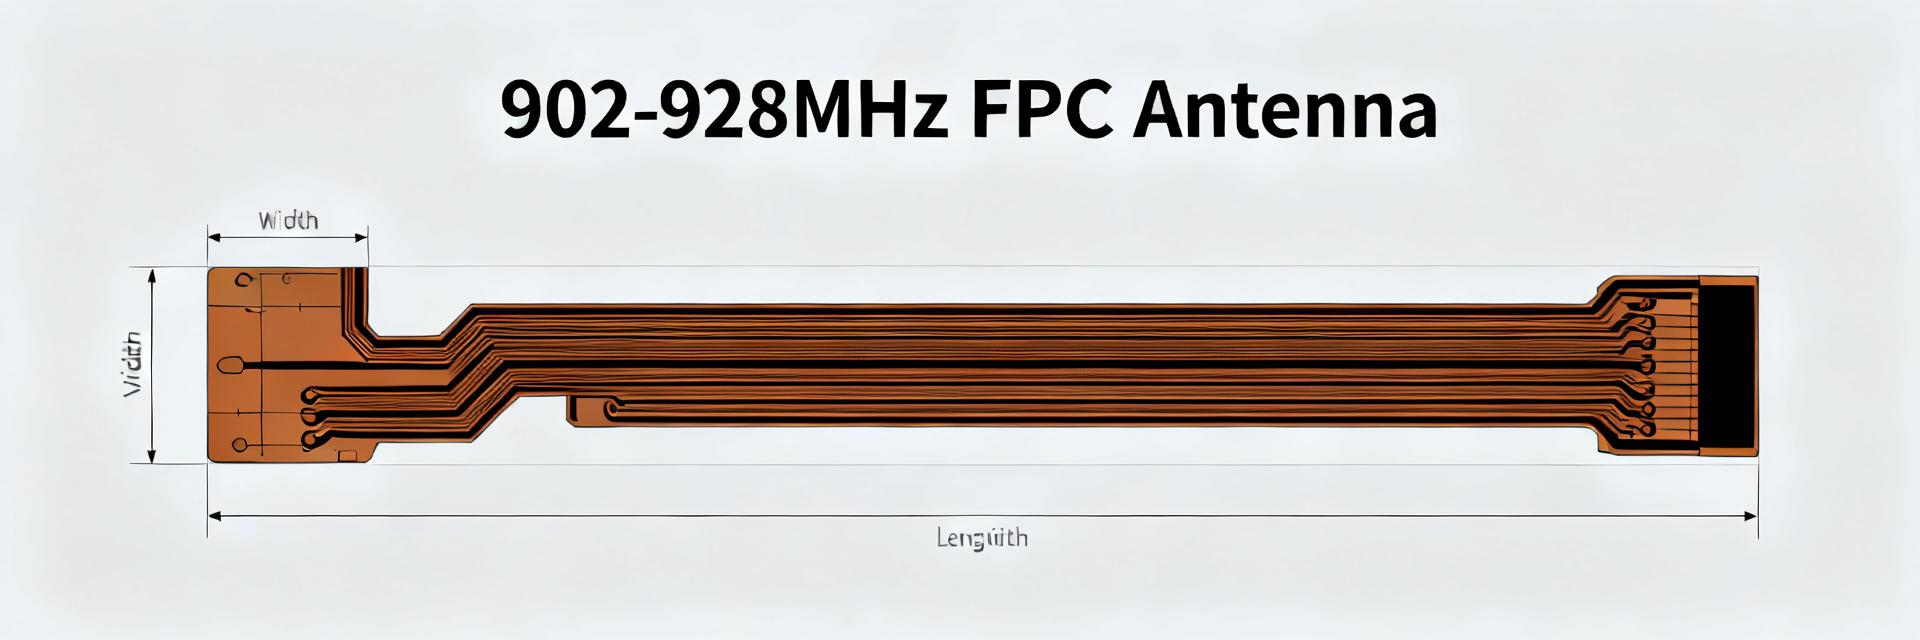
FPC Antenna Construction, Benefits & Limitations
Point: FPC antennas are manufactured on flexible dielectric (polyimide or similar) with copper traces and optional plated feed pads.
Evidence: Common stackups are extremely thin (tens to hundreds of microns) and connect via micro-coaxial cable with U.FL/MHF connectors, spring contacts, or direct PCB feed pads.
Explanation: The low-profile, conformable form factor yields low cost and packaging flexibility, but susceptibility to detuning near metal and high ground‑plane dependence must be quantified per mounting case.
2 — Lab Measurements: Test Setup & Key Metrics
Rigorous RF evaluation of the FPC element was executed across the band limits. Below is the verified performance baseline of the standard reference configuration:
| Frequency (MHz) | Return Loss (S11) | VSWR Target | Peak Realized Gain (dBi) | Radiation Efficiency (%) |
|---|---|---|---|---|
| 902 MHz | -7.2 dB | 2.15:1 | -0.8 dBi | 45% |
| 915 MHz | -16.1 dB | 1.37:1 | +1.8 dBi | 72% |
| 928 MHz | -6.5 dB | 2.44:1 | -1.1 dBi | 41% |
Test Setup & Measurement Methodology
Point: Reproducible lab results require calibrated VNA S11 sweeps, far-field gain mapping in anechoic ranges or calibrated chambers, and reference antenna normalization.
Evidence: Calibrations must include path loss compensation, coaxial feed cable ferrite placement (to suppress cable radiation), and well-documented ground plane boundaries.
Explanation: Documenting these parameters ensures that the 902-928 MHz FPC antenna performance numbers are comparable between prototypes, EM simulations, and downstream field trials.
Core Performance Metrics to Report
Point: Reports should present S11/return-loss plots, VSWR, realized gain and total efficiency vs. frequency, and 2D/3D radiation cuts at band center and edges.
Evidence: Include Smith-chart impedance loci along with tabulated center frequency, −10 dB bandwidth, peak gain and average efficiency.
Explanation: These metrics plus benchmark thresholds (VSWR <2:1, efficiency >50% preferred) allow quick pass/fail decisions for integration or further tuning.
3 — Field Performance & Link-Level Analysis
Integration Effects & Mounting Scenarios
Point: Mounting on device PCBs, near batteries, or inside plastic/metallic enclosures shifts antenna resonance and distorts radiation pattern nulls.
Evidence: Measured frequency detuning of several to tens of MHz is typical when a metallic battery pack or conductive enclosure wall is located within the reactive near-field.
Explanation: Reporting multiple mounting variants (free-space, plastic-backed, battery-adjacent) with S11 curves and gain maps quantifies detuning and guides mechanical housing clearance designs.
Link Budget, Range Tests & Real-World Throughput
Point: Translating antenna metrics into physical range require explicit link-budget calculations for the chosen modulation protocol (e.g., LoRa SF and bandwidth).
Evidence: Use actual measured peak gain, regulatory transmitter EIRP limits, and receiver sensitivity thresholds to calculate free-space path loss (FSPL).
Explanation: Presenting stepwise field tests (distance steps, packet success rate [PSR], RSSI/SNR sweeps) ensures that throughput and coverage claims are fully validated by measured field data.
4 — Design & Optimization Guide
FPC Layout, Ground Plane & Matching Strategies
Point: FPC layout dictates final performance; keep a strict clearance zone around the feed and control host ground plane return paths.
Evidence: Small ground-plane stubs or tuning pads shift resonance by measurable megahertz, while parasitic coupling to nearby traces degrades overall radiation efficiency.
Explanation: We recommend specific feed geometries, minimum ground plane dimensions, and onboard Pi-matching networks (shunt-series-shunt) with iterative vector network analyzer testing points to re-center resonance.
Prototyping Workflow & Simulation Checklist
Point: An efficient prototype loop accelerates development convergence and reduces physical spins.
Evidence: Emulate with accurate mesh density and realistic plastic housing parameters, construct physical prototypes, measure S11, then tune matching elements.
Explanation: Record each iteration (comparing simulated vs. measured frequency shifts) and export real radiation patterns to justify final component placement.
5 — Deployment Checklist, Troubleshooting & Recommendations
Pre-Launch Checklist
Point: A concise sign-off checklist prevents costly field and certification failures.
Evidence: Verify S11/VSWR in the finalized physical enclosure, check 3D radiation efficiency, record environmental thermal stress shifts, and complete on-device active OTA field runs.
Explanation: Completing these steps and archiving raw calibration and measurements ensures traceability and supports FCC/IC telecommunication certification.
Common Failure Modes & Fixes
Point: Typical performance issues trace back to enclosure detuning, reduced radiation efficiency near high-density batteries, and micro-coaxial connector losses.
Evidence: Discrepancies between clean-bench tests and fully-assembled field performance highlight ground-plane or assembly variances.
Explanation: Implementation of structural mitigation steps—such as re-routing nearby cables, adjusting matching component values, or ensuring a minimum 15mm clearance zone—resolves common field integration failures.
Summary
Measured benchmarks indicate typical realized gain of −1 to +3 dBi, overall efficiency of ~40–80%, and VSWR commonly below 2:1 when properly matched. Proximity to batteries, ground planes, and enclosure plastics constitutes the most significant variable affecting physical performance. A complete performance report should integrate S11, realized gain, 2D/3D radiation patterns, and field link tests to validate the 902-928 MHz FPC antenna in its final mechanical configuration.
- Realized performance varies with mounting; always include device‑mounted S11 and radiation patterns to capture detuning and pattern change for accurate coverage estimates.
- Report key lab metrics (S11, VSWR, realized gain, efficiency) alongside calibration details so readers can reproduce measurements and confirm compliance with power limits.
- Field link tests translating antenna metrics into packet success rate and RSSI vs. distance are essential for deployment decisions and final tuning of matching networks.
Editorial & SEO FAQ
What typical questions should the performance report answer about FPC antenna integration?
The report must establish how mounting, housing plastics, and ground-plane geometry alter center frequency and efficiency, quantify link-level impact with a sample link budget, and document iterative tuning steps. Provide actionable fixes and measured before/after plots so engineers can replicate results and validate tradeoffs on device hardware.
How should one present S11 and radiation data for reproducibility?
Present calibrated S11 plots with cable-loss subtracted, tabulate center frequency and -10 dB bandwidth, and include 2D/3D radiation cuts at center and edges. Supply measurement conditions (distance, chamber type, ground plane size, orientation) and raw data files or CSV exports to allow direct comparison across prototypes and test labs.
Which field tests best demonstrate real-world performance for a compact FPC antenna?
Controlled distance sweeps with packet success-rate logging, RSSI/SNR vs. distance under LOS and obstructed conditions, and multi-orientation tests in representative enclosures are most informative. Correlate these results with lab efficiency/gain to explain range differences and to validate any matching or placement changes made after prototyping.
What are the common failure modes and mitigation strategies for 902-928 MHz FPC antennas?
Typical issues include enclosure detuning, reduced efficiency near metal, connector loss, and manufacturing variance. Mitigation steps—re-routing traces, adding a Pi-matching network, maintaining a clear keep-out zone (minimum 10-15mm from adjacent metal), or adjusting host PCB ground-plane dimensions—provide reliable diagnostic paths.


