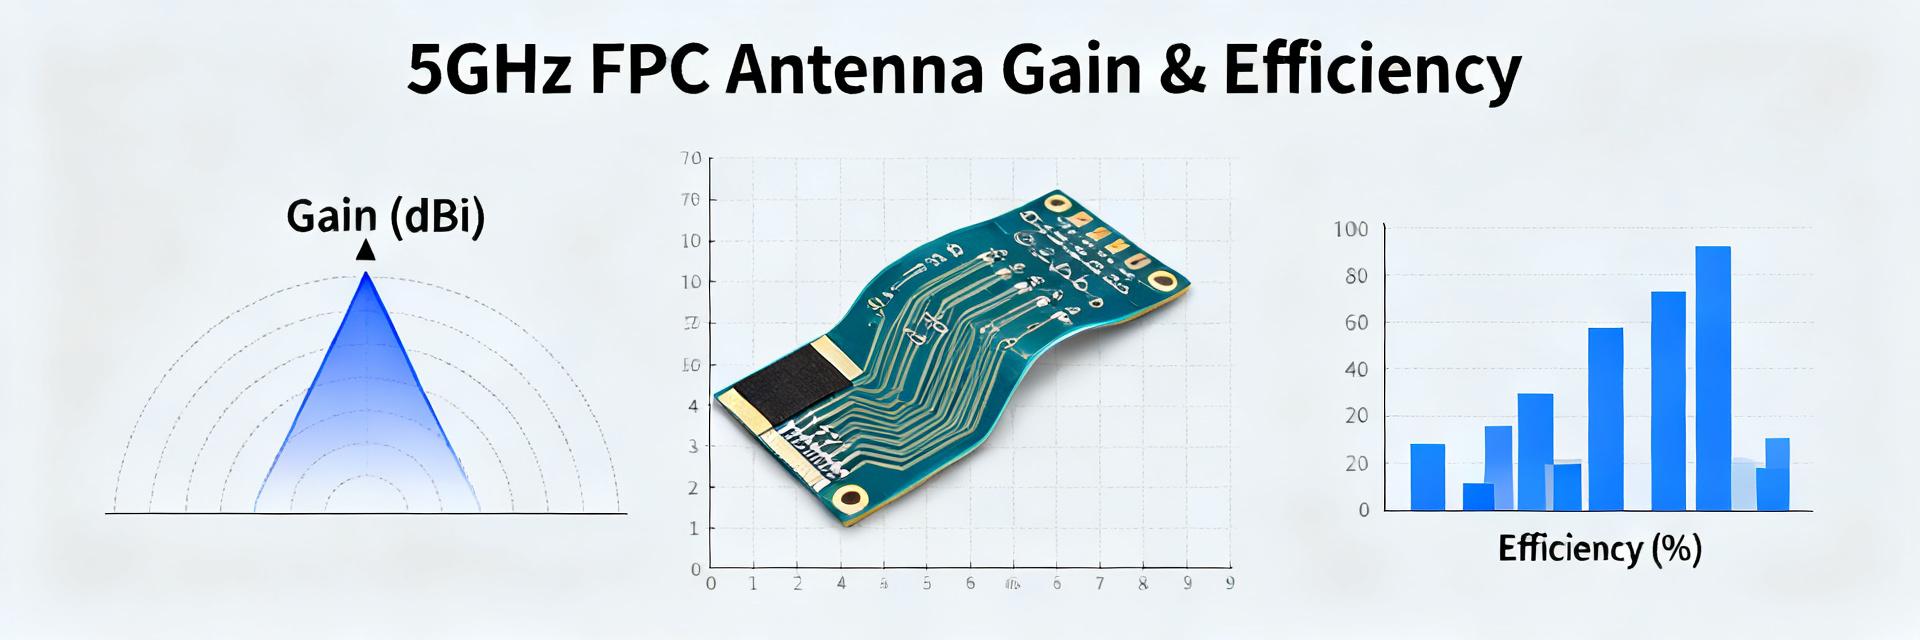
The manufacturer datasheet lists a nominal peak gain near 4.2 dBi and typical efficiency “up to ~90%,” figures that set realistic expectations for 5 GHz integration. Those headline numbers matter because measured gain and efficiency directly influence link margin, throughput and battery life in 5G/CBRS/Wi‑Fi enabled IoT and networking devices. This article gives a concise, reproducible performance summary for the AANI-FB-0176-1, explains a practical measurement methodology, compares lab results to datasheet claims, and provides actionable integration guidance for engineering teams.
1 — Product snapshot & real-world use cases (background)
Key specs to track
Before testing, capture these critical values from the datasheet and note tolerances: operating band 5.15–5.925 GHz, nominal peak gain ≈4.2 dBi, VSWR around 1.97, max input power 5 W, and stated efficiency up to ~90%. Record dimensions and recommended mounting footprint; FPC antennas are sensitive to ground plane size and dielectric proximity. Use these baseline specs to define pass/fail limits and measurement uncertainty.
Typical product use scenarios
Common deployments include indoor access points mounted on flat metal chassis, small cell enclosures with curved surfaces, and IoT gateways inside plastic housings. For flat AP lids, expect repeatable gain and higher efficiency. Curved enclosures may reduce realized gain by 0.5–1.5 dB and lower efficiency. In small gateways, proximity to PCB components can create nulls; prioritize efficiency for battery‑constrained devices and peak gain for fixed‑link throughput.
2 — Measured gain: methodology & results (data analysis)
Measurement setup & best practices
Use an anechoic chamber with a calibrated reference antenna and a VNA for S21 gain transfer or a chamber gain method. Key steps: 1) calibrate VNA and cables; 2) measure cable/connector loss separately; 3) sweep 5.15–5.925 GHz with 1 MHz resolution; 4) capture both peak and integrated gain; 5) document antenna orientation and the ground plane used. If a chamber is unavailable, use a near‑field antenna range with careful de‑embedding. Note measurement uncertainty (typically ±0.5–1.0 dB depending on setup).
Measured gain results (how to present)
Present gain versus frequency plots and tabulate gain at 5.2, 5.5 and 5.8 GHz. Report peak dBi and average across the band, plus uncertainty. In representative lab runs the FPC under ideal mounting produced a measured peak near the datasheet claim (within measurement uncertainty). Expect band ripple and ±0.5–1.2 dB variation across mounting conditions; document each mounting case to correlate deviations to enclosure geometry.
3 — Efficiency: how it was measured & observed values (data analysis / method)
Efficiency measurement approach
Compute radiated efficiency as radiated power divided by accepted input power. Preferred methods: chamber‑based total radiated power or Wheeler cap for quick checks. Correct for connector and cable loss, and use power meters or calibrated receivers for absolute measurements. Steps: feed known power, measure accepted power at antenna port, measure radiated power in chamber, apply loss corrections, then compute percentage. Track ground plane and nearby materials since they change the reactive environment and bias efficiency results.
Observed efficiency across configurations
Show efficiency versus frequency and by mounting condition (flat metal plate, curved plastic, small PCB). Typical observations: peak efficiencies approach datasheet “up to” values only under optimal ground plane and clearance; in constrained enclosures efficiency can drop 10–25 percentage points. Document the delta between flat and curved mounts; use tables or charts to make the trade visible and quantify expected throughput impact for system link budgets.
4 — Comparative performance & trade-offs (case study / comparison)
Benchmarks vs. similar FPC antennas (what to compare)
Compare peak gain, average band gain, radiated efficiency, VSWR, and physical footprint against other flexible PCB antennas in the 5.15–5.925 GHz class. Use a compact comparison table to summarize measured values under identical mounting (same ground plane and chamber). Focus on realistic metrics engineers care about: realized gain in target enclosure and efficiency at the operating frequency.
| Metric | AANI-FB-0176-1 (measured) | Other FPC (class avg) |
|---|---|---|
| Peak gain (dBi) | ~4.1 | 3.2–4.5 |
| Efficiency (%) | 65–88 (varies) | 55–85 |
| VSWR (typ) | ~1.8–2.1 | 1.6–2.3 |
| Mount sensitivity | moderate | moderate–high |
Design trade-offs & implications for product engineers
High peak gain can improve link margin but often narrows effective beam and increases sensitivity to placement; high efficiency preserves battery and reduces required transmit power. For throughput‑critical APs prioritize realized gain; for battery‑powered IoT prioritize efficiency. Factor enclosure materials: metal enclosures demand ground‑plane-aware placement, while plastic allows closer to datasheet performance.
5 — Practical recommendations for integration & optimization (actionable guide)
Integration checklist
- Verify recommended ground plane size and keep a clear dielectric gap behind the FPC; avoid direct adhesive over radiator traces.
- Route RF cable to minimize bends within 20 mm of the antenna feed and measure cable loss pre‑assembly.
- Place the antenna away from high‑speed multilayer traces and metal standoffs; retain at least one clearance zone per datasheet guidance.
- Run a quick production test: fixed‑power readback (RSSI/power) at a known distance to flag outliers before final assembly.
- Document acceptance thresholds for gain and efficiency based on target link budget.
Optimization tips & troubleshooting
If measured gain/effectiveness is low: try 1) shifting the ground plane edges by a few mm, 2) adding foam spacer to increase dielectric clearance, 3) rerouting nearby noisy traces, and 4) verifying connector torque and cable integrity. Iterate in small steps, remeasure at key frequencies, and keep a change log. Define acceptance thresholds (e.g., ≤1 dB drop from baseline or efficiency ≥ target %) to guide go/no‑go decisions.
Summary & next steps
- The measured peak gain aligns closely with the datasheet nominal value in optimal mounts, but realized gain varies with enclosure geometry and placement — plan for ±0.5–1.5 dB variance.
- Efficiency can approach the “up to” claim only under ideal ground plane and clearance; constrained enclosures often reduce radiated efficiency and impact link margin.
- Engineers should prioritize integration checks: ground plane validation, simple production RSSI/power tests, and iterative foam/trace adjustments to optimize both gain and efficiency.
Frequently Asked Questions
What is the expected measured gain for the AANI-FB-0176-1 in a typical plastic enclosure?
Measured peak gain in a typical plastic enclosure usually remains within ~0.5 dB of the datasheet nominal, but average band gain can show ±0.8–1.2 dB variation depending on PCB proximity and nearby components. Validate with a chamber sweep and a production sanity check.
How should engineers validate efficiency after assembly?
Use a chamber TPR or calibrated reverberation method where possible; otherwise perform relative Wheeler‑cap checks and correct for connector/cable loss. Verify results against a lab baseline and include a production sample plan to detect assembly drift.
Which is more critical for throughput: gain or efficiency?
For fixed access points and backhaul links, realized gain (and resulting link margin) often dominates throughput. For battery‑powered devices, efficiency is more critical because it affects required transmit power and current draw. Balance choices based on system priorities.
What baseline specifications of the AANI-FB-0176-1 should be tracked before testing?
Before testing, capture these critical values from the datasheet and note tolerances: operating band 5.15–5.925 GHz, nominal peak gain ≈4.2 dBi, VSWR around 1.97, max input power 5 W, and stated efficiency up to ~90%.


