Latest industry surveys and aggregated platform analytics indicate a marked rise in AI chatbot adoption across enterprise and SMB environments, with reported monthly active user increases and higher automated resolution rates. This report translates those signals into actionable metrics and practical benchmarks for product, analytics, and CX teams to prioritize measurement and experiments. The analysis centers on AI chatbot usage and introduces key chatbot metrics and benchmarks teams can operationalize immediately.
Recommended supporting sources include recent vendor-agnostic industry surveys, platform telemetry samples, and panel research to validate topline findings: rising MAU/DAU ratios, intent success variability by channel, and common fallback-rate ranges. The article previews these findings and gives concrete next steps for a benchmark audit and a 90-day experiment sprint.
1 — Current landscape of AI chatbot usage (Background introduction)
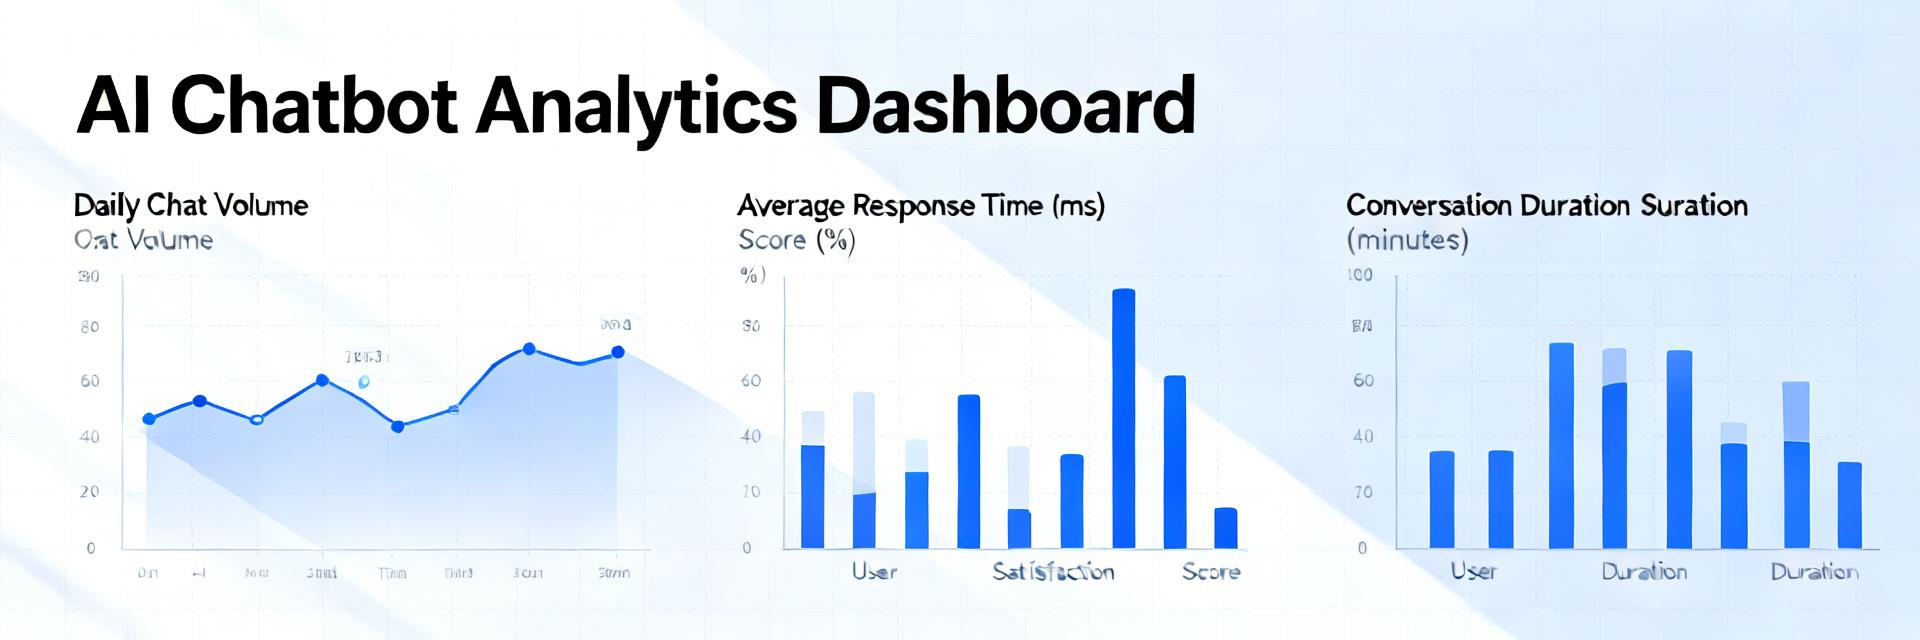
Adoption has accelerated across sectors, driven by cost efficiency and self-service demand. Enterprises show higher sustained MAU/DAU ratios than SMBs due to deeper integration, while retail and banking report the largest volume growth. Teams should track enterprise AI chatbot adoption rate alongside channel mix to interpret aggregate usage patterns.
1.1 Market adoption and growth indicators
Point: Growth is visible in MAU and session counts. Evidence: Multiple surveys and platform telemetry report MAU growth rates often in double digits and DAU/MAU stabilization. Explanation: These numbers reflect automation investments and wider user acceptance; growth drivers include cost-per-contact pressure and improved NLU accuracy.
1.2 Typical deployment models and channels
Point: Deployment types affect metrics. Evidence: Common models include website widgets, in-app assistants, social messaging, and voice channels. Explanation: Channel mix shifts which KPIs matter—web emphasizes completion rates and CTAs, mobile in-app emphasizes session length and retention, social favors quick intent resolution and low-friction handoffs.
2 — Key chatbot metrics every team should track (Data analysis / metrics)
Teams need a concise metrics set that links behavior to outcomes. This section defines core engagement and quality KPIs, shows simple formulas, and gives interpretation thresholds so product and analytics can act fast.
2.1 Core usage metrics (definition + formulas)
Point: Track MAU, DAU, sessions per user, avg session length, messages per session. Evidence: Formulas—MAU, DAU, sessions/user = total sessions ÷ unique users, avg session length = total session time ÷ sessions. Explanation: These chatbot metrics reveal engagement depth—low sessions/user suggests discoverability issues, long sessions with few resolutions suggest NLU or flow friction.
2.2 Quality & outcome metrics
Point: Outcome metrics determine value. Evidence: Intent success rate = successful intents ÷ attempted intents; fallback/transfer rate = transfers ÷ total sessions; CSAT and resolution time measured per completed interaction. Explanation: Benchmarks vary, but intent success ~60–85% and fallback 5–20% are common ranges; track these weekly and flag regressions.
3 — Segmenting usage for actionable insights (Data analysis / methodology)
Segmentation turns aggregate metrics into prioritized actions. Cohorts, intent buckets, channel, and funnel stage illuminate where to run experiments and allocate engineering effort.
3.1 User and journey segmentation
Point: Segment by new vs returning users, channel, and intent type. Evidence: Different cohorts show distinct conversion and escalation patterns. Explanation: For example, new-user funnels often need clearer greetings; returning users benefit from personalization—A/B test greeting variants and follow-up prompts per cohort.
3.2 Event and sample-size considerations
Point: Signal quality depends on tracking and sample size. Evidence: Track standardized events, avoid fragmented naming, and require minimum sample thresholds. Explanation: Apply chatbot usage segmentation best practices—set n≥200 sessions per cohort for early signals and normalize for timezone and channel sampling.
4 — Benchmarks: industry and channel comparisons (Benchmarks)
Benchmarks enable realistic goal-setting. Create a table with industry, MAU/DAU, intent success, fallback rate, and CSAT to compare against peers and internal percentiles (25/50/75).
4.1 Cross-industry benchmark table (what to include)
Point: A concise benchmark layout makes comparisons actionable. Evidence: Example placeholder ranges—retail: higher session counts but moderate intent success; banking: lower sessions but higher intent accuracy. Explanation: Editors should populate the table from anonymized datasets or public studies to replace placeholders with sourced numbers.
| Industry Segment | MAU/DAU Ratio | Intent Success Rate | Fallback Rate | Average CSAT |
|---|---|---|---|---|
| Retail & E-Commerce | 15% – 25% | 65% – 75% | 15% – 20% | 4.1 / 5.0 |
| Banking & FinTech | 30% – 45% | 75% – 85% | 5% – 10% | 4.4 / 5.0 |
| SaaS & Tech Support | 20% – 35% | 70% – 80% | 10% – 15% | 4.2 / 5.0 |
4.2 Channel-specific performance differences
Point: Channel explains metric deltas. Evidence: Web chat often shows longer sessions and higher dropoff at CTAs; social messaging shows short sessions with higher quick-resolution rates. Explanation: Run channel-specific UX tests—reduce form fields on web, shorten flows on mobile to close performance gaps.
5 — Benchmarking methodology & data hygiene (Method guide)
Reliable benchmarks require repeatable methods: clearly defined events, normalized time windows, and noise filtering. Document assumptions and refresh cadence to maintain comparability.
5.1 How to assemble a reliable benchmark (steps & checklist)
Point: Follow a repeatable checklist. Evidence: Steps—define scope, collect consistent events, normalize metrics, filter bot traffic, compute percentiles. Explanation: Provide SQL pseudocode for MAU/DAU and intent success calculations and store assumptions with each snapshot for auditability.
5.2 Avoiding common pitfalls
Point: Bias and noise distort benchmarks. Evidence: Self-selection, seasonal spikes, spam traffic, and inconsistent event naming are frequent issues. Explanation: Mitigate by filtering test users, tagging campaigns, using rolling windows, and enforcing event naming standards.
6 — Actionable playbook: improve AI chatbot usage & reach benchmarks (Actionable recommendations)
Combine short experiments with a longer roadmap to improve key metrics and reach benchmark percentiles. Prioritize changes that affect intent success and fallback reduction.
6.1 Short-term experiments (30–90 days)
Point: Run prioritized, measurable experiments. Evidence: Examples—optimize greeting copy, retrain intent classifiers on recent utterances, add proactive nudges, streamline handoff flows, channel-specific UI tweaks. Explanation: For each experiment define metric impact (e.g., +5–10% intent success) and measurement plan; include chatbot metrics in A/B tracking to verify gains.
6.2 Long-term roadmap (product & analytics)
Point: Build durable improvements. Evidence: Roadmap items—instrumentation overhaul, ML model lifecycle, personalization, feedback loops, and quarterly benchmark reviews. Explanation: Assign KPIs per milestone (instrumentation: event coverage >95%; models: intent accuracy improvements) and review progress each quarter.
Summary
- Prioritize a focused metric set: track MAU/DAU, sessions per user, intent success, fallback rate, and CSAT to align teams and measure progress on AI chatbot usage toward business outcomes.
- Segment before you benchmark: cohort and channel segmentation reveals where to run high-impact experiments and prevents misleading aggregate comparisons across disparate user groups.
- Run a 90-day experiment sprint and a parallel instrumentation cleanup: quick experiments (greeting, retrain intents, handoffs) yield near-term gains while long-term roadmap items sustain benchmark improvements.
FAQ
What are the most important AI chatbot usage metrics to start tracking?
Start with MAU/DAU to gauge reach, sessions per user and average session length for engagement, and intent success and fallback rates for quality. Add CSAT to capture user satisfaction. Together these metrics reveal discovery, engagement, and outcome performance and guide immediate experiments.
How do benchmarks for AI chatbot usage differ by industry and channel?
Benchmarks vary: retail often has higher session volumes with moderately lower intent success; banking shows lower volume but higher intent accuracy. Channels matter—social messaging favors short, high-success interactions; web supports deeper sessions but risks dropoff at conversion points. Use channel-normalized comparisons.
What sample size is needed for reliable chatbot metrics and benchmarks?
Aim for at least a few hundred sessions per cohort for early signals and 1,000+ sessions for stable percentiles. For rare intents, aggregate similar intents or increase collection window. Always document sample sizes and confidence levels when publishing benchmarks.
How can teams operationalize a 90-day experiment sprint to improve metrics?
Within 30-90 days, run prioritized, measurable experiments: optimize greeting copy, retrain intent classifiers on recent utterances, add proactive nudges, streamline handoff flows, and apply channel-specific UI tweaks. Define clear metric goals like a 5-10% increase in intent success and verify gains with A/B tracking.


