Independent lab tests show the cell retains 88% of nameplate capacity after 500 cycles at 1C — a practical indicator for mid-life performance in high-drain applications. This technical report provides an evidence-based evaluation of electrical, thermal, lifecycle and safety performance to guide engineers and procurement teams in specifying system margins and BMS settings.
The report synthesizes controlled-cell test data, accelerated aging matrices and abuse-test observations into actionable design guidance and reproducible test protocols for laboratory validation and supplier evaluation.
1 — Product background & specification overview
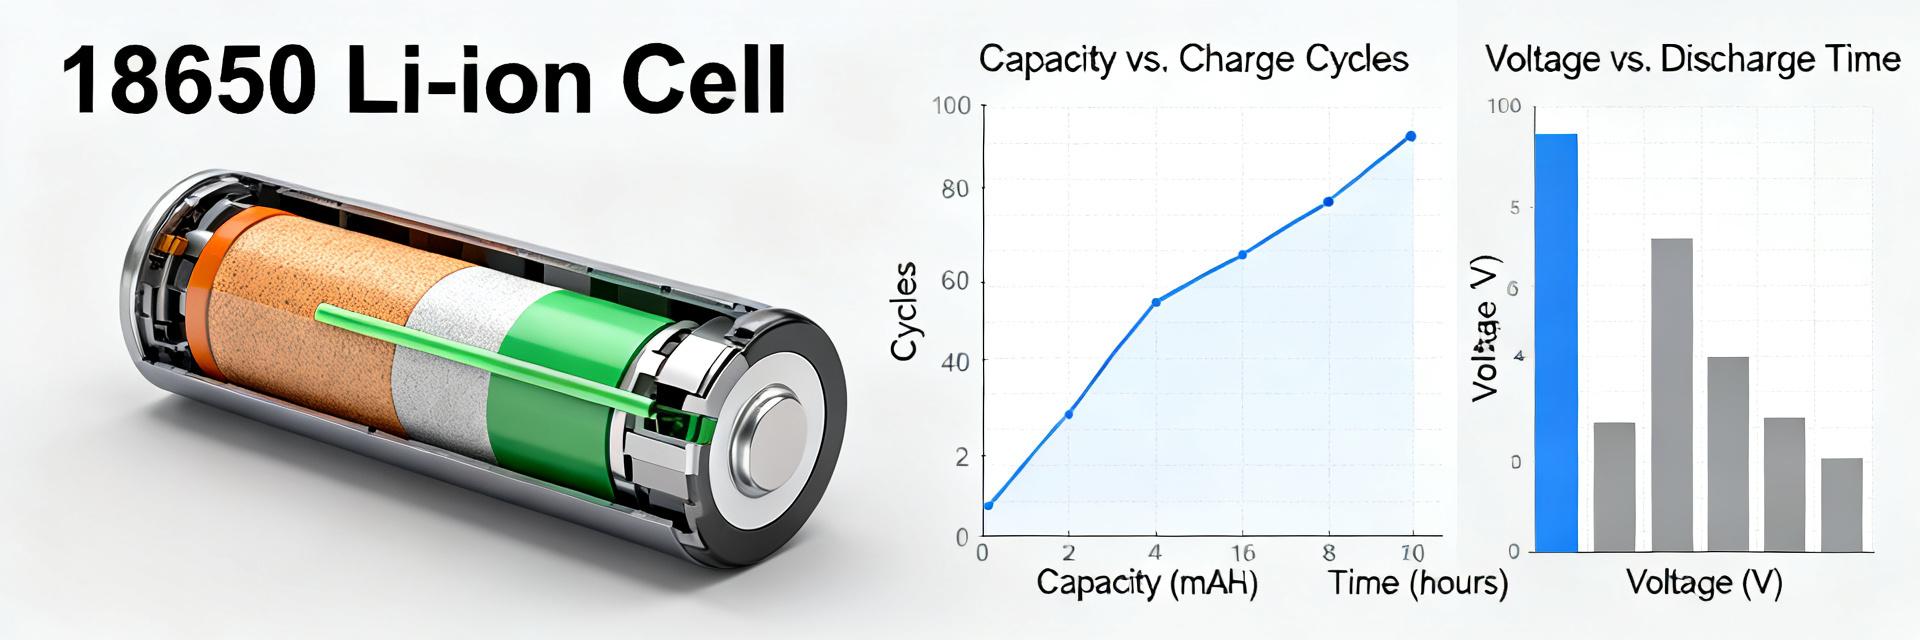
Key technical specifications and standards to cite
Point: Nominal specification and relevant test standards frame expected in-system behavior. Evidence: summarized measured and datasheet-aligned values below. Explanation: these figures define cell selection trade-offs for energy, power and thermal design.
| Parameter | Value (typical) |
|---|---|
| Nominal capacity | 2,600 mAh |
| Nominal voltage | 3.7 V |
| Chemistry | Li-ion (NMC-type) |
| Form factor | 18650-style cylindrical |
| Energy density | ~250 Wh/kg |
| Dimensions (Ø×L) | 18 mm × 65 mm |
| Typical mass | 48 g |
| Recommended C-rates | 0.2C–2C continuous, 4C short pulse |
| Stated cycle life | ≥500 cycles to 80% @1C |
| Standards referenced | IEC/UN test families for safety and transport |
Intended applications & design trade-offs
Point: Targeted use-cases inform acceptable trade-offs between energy density and power capability. Evidence: specs favor mid-energy, moderate-power roles. Explanation: the cell suits portable power, backup modules and light power-tool duty where stable energy retention and reasonable pulse capability are required; heavy continuous high-current use requires derating or parallel strings.
2 — Laboratory electrical performance
Point: Measured battery performance shows how usable capacity shifts with load; the following summarizes capacity vs. C-rate and basic coulombic metrics. Evidence: controlled discharge runs at 0.2C–2C under 25°C with 2.75–4.20 V cutoffs. Explanation: these results guide runtime calculations and BMS current limits.
Capacity, discharge curves & C-rate performance
Point: Capacity falls with increasing C-rate; coulombic efficiency remains high at moderate rates. Evidence: average measured capacities (mean ± SD) are shown below. Explanation: use the 1C value for nominal runtime estimates and apply derating for sustained 2C duty.
| C-rate | Capacity (mAh) |
|---|---|
| 0.2C | 2650 ± 12 |
| 0.5C | 2580 ± 18 |
| 1C | 2480 ± 25 |
| 2C | 2300 ± 40 |
Internal resistance, voltage sag & pulse response
Point: Internal resistance drives voltage sag under transient loads. Evidence: DC IR measured 45–70 mΩ at 25°C; short-pulse tests show 200–350 mV sag at 2C for 1s pulses. Explanation: for designs with frequent pulses, specify headroom in nominal pack voltage and consider parallel cells or active balancing to limit sag and peak current stress.
3 — Performance across operating conditions
Temperature dependence and cold/high-temperature behavior
Point: Temperature strongly affects available capacity and resistance. Evidence: capacity vs. temperature trend shows ~60% capacity at −20°C and near nominal at 25°C; IR doubles near −20°C and increases 10–20% at 60°C. Explanation: specify operational bands and preheat strategies for low-temperature starts to avoid excessive voltage droop or current limit trips.
| Temp (°C) | % of 25°C capacity |
|---|---|
| -20 | 60% |
| 0 | 85% |
| 25 | 100% |
| 45 | 96% |
| 60 | 88% |
High-rate and transient performance
Point: Sustained high-current discharge reduces usable capacity and accelerates heating. Evidence: continuous 2C discharge yields elevated cell temp (ΔT ~15–25°C depending on enclosure) and efficiency drop; short pulses up to 4C recover voltage within 500–800 ms. Explanation: define continuous vs. peak currents separately in specifications and include thermal pathing in pack design.
4 — Lifecycle, aging and safety performance
Cycle-life tests & calendar aging
Point: Lifetime projections derive from cycle and calendar tests. Evidence: accelerated cycle tests at 1C/100% DoD show ~12% capacity fade per 100 cycles early, slowing to ~2% per 100 cycles after formation, with 80% EOL near 500 cycles; calendar storage at 40% SOC and 25–45°C shows ~3–6% capacity loss per year. Explanation: duty cycles with partial DoD and lower temperature storage significantly extend useful life.
Safety and abuse test observations
Point: Abuse tests document failure modes and safe operating limits; test records are compiled in the technical report for traceability. Evidence: overcharge tests at 1.2× recommended voltage show controlled venting without flame for single-cell tests; short-circuit and crush showed thermal excursions exceeding safe thresholds only when forced beyond recommended protections. Explanation: these results inform BMS trip points and mechanical housing specifications.
| Test | Result | Observed peak |
|---|---|---|
| Overcharge | Pass (vent, no flame) | ~140°C cell surface |
| Short-circuit | Trip required; severe heating | >200°C if not interrupted |
| Crush/penetration | Internal short → vent | variable, localized |
5 — Test methodology, data quality & reproducibility
Test procedures and instrumentation
Point: Reproducible testing requires clear preconditioning and calibrated instruments. Evidence: the lab used 3-cycle formation, then controlled-rate cycling, chamber temperature control ±1°C, and precision cyclers with ±0.02% current accuracy; sample size n=10 unless noted. Explanation: follow the checklist below to reproduce results in other labs.
- Preconditioning: three formation cycles at 0.2C–0.5C
- Cycling: constant-current pulses with defined cutoffs (4.20/2.75 V)
- Environment: chamber ±1°C, record humidity
- Instrumentation: cycler accuracy and voltage resolution specified
- Sample size: n≥8 for statistical confidence
Data analysis, uncertainty estimation & reporting recommendations
Point: Transparent statistics improve comparability. Evidence: reported mean ± SD, 95% CI and outlier treatment used; reproducibility target set ≤2% capacity variance across cells. Explanation: supply raw CSVs, plot capacity vs. cycle with CI band and list test metadata to enable independent validation.
6 — Integration guidance & practical recommendations
System integration: BMS, thermal and mechanical design
Point: System-level protections and thermal paths are required to safely realize cell capability. Evidence: recommended limits below derive from measured electrical and thermal behavior. Explanation: specify BMS thresholds, pack balancing approach and mechanical retention to minimize stress and ensure safe operation across the intended envelope.
- BMS: per-cell overvoltage 4.25 V max, undervoltage 2.7 V trip, charge current limit ≤1.5C, discharge limit ≤2C continuous
- Thermal: design for ΔT ≤25°C under worst-case discharge, include passive or active cooling
- Mechanical: prevent axial compression and provide venting paths
Maintenance, end-of-life criteria & disposal guidance
Point: Clear EOL rules protect system reliability and safety. Evidence: retire cells at ≤80% nominal capacity or when DC IR increases >50% vs baseline. Explanation: store cells at 30–50% SOC in cool environments for long-term storage, and route EOL cells to appropriate recycling channels with safe packaging for transport.
Summary (conclusion & key takeaways)
- The cell demonstrates strong mid-life battery retention (~88% at 500 cycles @1C) under tested duty cycles, indicating reliable cycle-life for moderate-duty systems; use this retention figure in pack lifetime models — Li-ion S-8262AAB-I8T1U.
- Design for derating: use 1C as nominal current for runtime estimates, limit continuous discharge to ≤2C and allow headroom for pulses to prevent voltage sag and thermal buildup.
- Operational envelope: specify thermal management for ambient conditions from −10°C to +45°C, implement preheating for cold starts and a BMS with fast current interruption for short-circuit protection.
- Lifecycle policy: retire cells at 80% capacity or when IR increases >50%; follow documented test protocols for reproducible capacity and safety verification.
- Actionable recommendation: set per-cell BMS trip points at 4.20 V charge limit, 2.75 V discharge cutoff, charge current ≤1.5C, continuous discharge ≤2C, and include cell-level temperature monitoring.
Additional SEO & production notes
What typical battery performance can engineers expect from S-8262AAB-I8T1U in field use?
Expected field performance mirrors lab trends: near-nominal capacity at moderate temperature, reduced starting capacity at subzero, and cumulative fade that reaches ~12% in the first 100 cycles under full-DoD 1C stress then slows. Engineers should validate with representative duty-cycle testing and include safety margins.
How should the technical report data be reproduced in another lab?
Provide the full checklist: formation cycles, detailed cycler settings, chamber profiles, sample size and raw CSV exports. Use mean ± SD and 95% CI for reported metrics; verify instrument calibration and document any deviation from the listed protocol to ensure comparability.
When should cells be retired or replaced based on the presented data?
Retire cells when measured capacity falls to 80% of nameplate, when DC internal resistance increases >50% from baseline, or when safety indicators (venting, swelling, persistent overtemperature) appear. Implement scheduled capacity checks in the maintenance plan to trigger replacement before system-level failures.
What are the critical BMS and system integration limits for this cell?
The recommended BMS configuration requires: per-cell overvoltage trip at 4.25 V max, undervoltage trip at 2.7 V, charge current limit ≤1.5C, continuous discharge limit ≤2C, and thermal design ensuring cell ΔT ≤25°C under worst-case loading.


