Point: Recent sales and POS datasets point to accelerating sneaker demand across performance and lifestyle segments driven by omnichannel buying, resale growth, and changing consumer priorities.
Evidence: Multiple retail panels and marketplace signals show broader velocity on limited releases and steady baseline interest.
Explanation: Retailers must align assortment and launch cadence to capture this blended growth.
Point: This overview synthesizes topline trends to show where sneaker sales expand, which segments underperform, and recommended actions.
Evidence: Channel mix shifts and AOV (Average Order Value) movement suggest omnichannel customers buy differently than single-channel shoppers.
Explanation: The analysis focuses on measurable KPIs and practical experiments retailers can run in the US market.
US Sneaker Market Snapshot (Background)
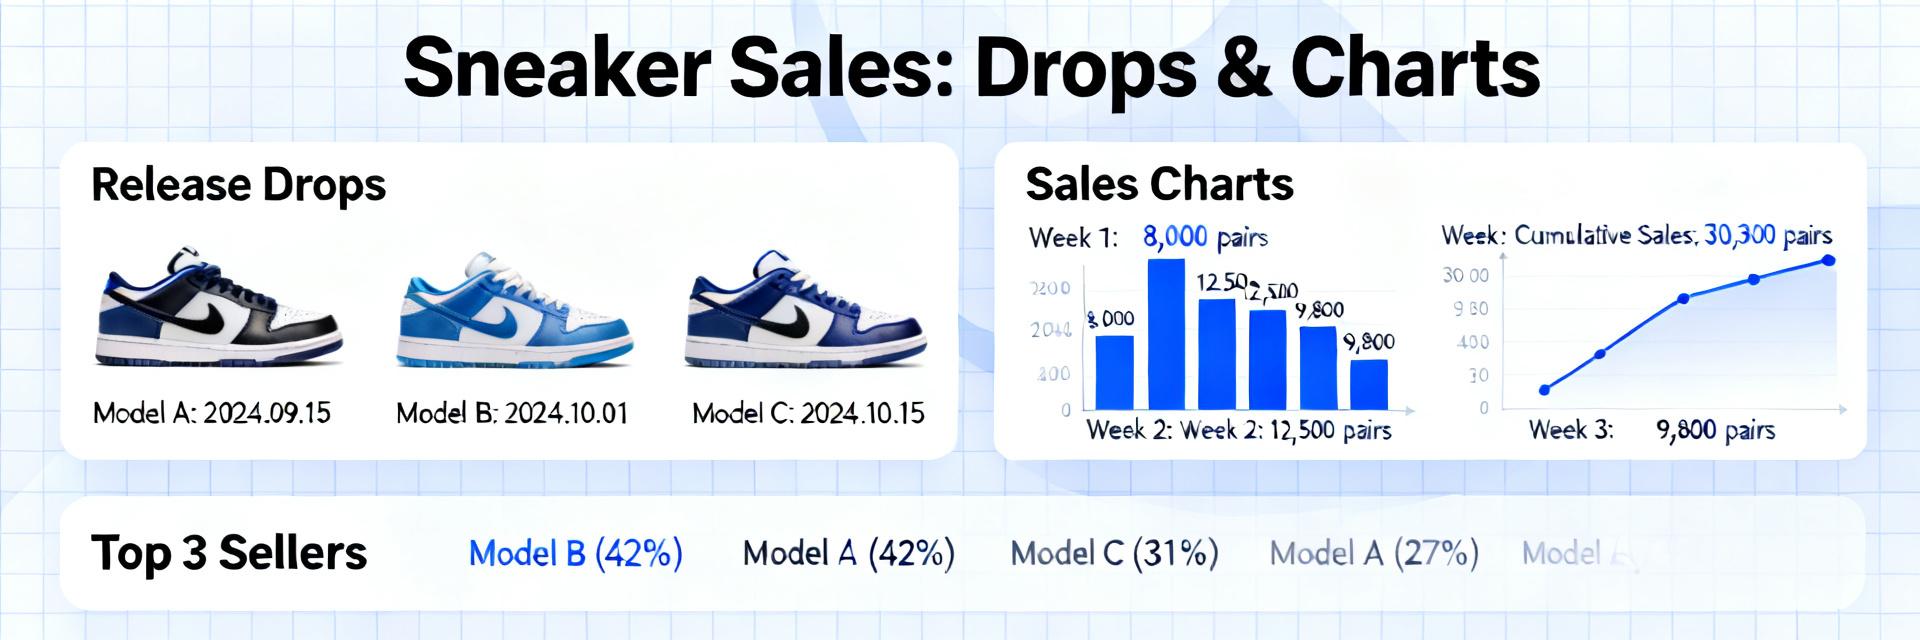
Market size & growth drivers
Point: The US market exhibits qualitative expansion in value and stable-to-rising unit activity, supported by athleisure, fitness participation, and lifestyle adoption. Evidence: Year-over-year descriptions show rising category interest, channel diversification, and modest AOV increases. Explanation: Demand drivers combine fashion cycles and performance use, so assortment should balance new drops with durable baselines to capture both shoppers.
Distribution channels & sales funnels
Point: Brick-and-mortar, DTC, marketplaces, and resale play distinct roles in conversion and margins. Evidence: Physical stores sustain discovery and returns, DTC maximizes margin, marketplaces scale reach, and resale boosts premiumization. Explanation: Track channel-level conversion rate and return rate alongside CAC (Customer Acquisition Cost) to optimize allocation and fulfillment strategies for each channel.
Sales Trends & Segment Performance (Data analysis)
The matrix below outlines performance vs. lifestyle segment performance across major channels, capturing core behaviors that shape overall US demand velocity.
| Segment | Primary Channel | Growth Driver | Inventory Velocity | Margin Profile |
|---|---|---|---|---|
| Performance Footwear | DTC / Specialty Retail | Athletic use & utility | Seasonal / Stable | Moderate-High |
| Lifestyle & Casual | Marketplace / Resale | Scarcity & Culture | Rapid (Drop-driven) | High Premium |
New-product vs. resale market dynamics
Point: Limited drops and new-product releases drive short-term visibility while resale platforms capture premium value and extend product life. Evidence: Inventory velocity for drops often outpaces mainstream releases, while resale indices show premium persistence. Explanation: Monitor sell-through, sell-out times, and secondary-market price indices to calibrate release cadence and pricing strategy.
Performance footwear vs. lifestyle/casual
Point: Performance sneakers (running, training) follow utility and seasonality; lifestyle skews on silhouette and cultural resonance. Evidence: Performance sales track participation cycles and promotion cadence; lifestyle benefits from limited editions and influencer momentum. Explanation: Use targeted marketing levers—technical storytelling for performance, scarcity and cultural narratives for lifestyle—to manage product lifecycles.
Channel & Regional Patterns in the US (Data analysis)
Online vs. in-store sales dynamics
Point: Online conversion funnels differ materially from in-store behavior, with mobile-first checkout and BOPIS (Buy Online, Pick Up In Store) shaping fulfillment costs. Evidence: Mobile sessions show lower AOV but higher frequency; BOPIS raises conversion while smoothing last-mile costs. Explanation: Monitor online conversion, store footfall to sell-through, and fulfillment cost per order to prioritize investments in web UX and store pick models.
Regional hotspots & demographic skews
Point: Demand concentrates in urban coastal hubs and select college towns, with heartland markets favoring baseline assortments. Evidence: Demographic skews show younger cohorts and higher-income bands driving limited-drop fervor. Explanation: Adopt geo-segmentation: tighter limited-drop allocations in urban micro-markets and broader baseline coverage in heartland channels for efficient sell-through.
What Drives Consumer Purchase Decisions (Method / Guide)
Price, design, and cultural influence
Point: Price point, silhouette, and cultural endorsement each shift purchase probability differently across cohorts. Evidence: A/B creative tests and price elasticity checks reveal distinct lift patterns for scarcity messaging versus discounting. Explanation: Run promo lift tests and creative A/B experiments to quantify which combination of price and design messaging moves conversions per segment.
Sustainability, resale interest, and product lifespan
Point: Sustainability claims and resale value increasingly influence perceived product value and aftercare choices. Evidence: Shoppers reference second-life value when choosing higher-AOV items; labelled materials and repairability raise resale prospects. Explanation: Use clear copy and durable labeling to improve perceived resale value and track second-life resale price as a proxy for brand equity.
Winning Retail & Brand Playbooks (Case / Examples)
Omnichannel and drop strategies that work
Point: Effective playbooks combine limited drops with broad baseline SKUs and membership gating to protect margins. Evidence: Successful launches rely on inventory buffers, queueing tech, and fraud controls to sustain customer experience. Explanation: Measure sell-through within 48–72 hours and repeat purchase lift post-launch to validate cadence and membership effects.
Resale partnerships & circular-economy tactics
Point: Integrating resale—co-branded channels, buyback, certified pre-owned—can reclaim margin and extend lifecycle. Evidence: Pilots show margin trade-offs are manageable when authenticity and certification reduce friction. Explanation: Follow a three-step pilot: define grade standards, set buyback pricing rules, and integrate authenticated listings into DTC channels to test margins and brand impact.
Tactical Playbook: Actionable Steps for the Next 12–24 Months (Action recommendations)
Short-term tactics (0–12 months)
Point: Immediate actions include tightening omnichannel tracking, optimizing regional inventory, running conversion experiments, and testing premium resale pilots. Evidence: Short pilots reveal quick wins in allocation and UX that lift conversion. Explanation: Prioritize KPIs—sell-through, return rate, CAC, repeat purchase rate—and run iterative experiments to refine allocation and messaging while monitoring sneaker demand.
Long-term positioning & investment priorities (12–24+ months)
Point: Invest in forecasting, supply-chain agility, community-building, and sustainability to secure future growth. Evidence: Capability investments yield stronger margin and responsiveness in later cycles. Explanation: Evaluate investments using ROI lenses focused on reduced markdowns, faster replenishment, higher lifetime value, and improved resale metrics to sequence priorities.
Summary
- Omnichannel expansion and resale influence mean retailers must balance limited drops with strong baseline assortments to capture evolving sneaker demand and stabilize revenue across channels.
- Performance and lifestyle segments require different levers: technical storytelling and participation timing for performance; scarcity and cultural marketing for lifestyle growth.
- Regional and channel data should drive assortment and launch cadence—geo-segmentation and BOPIS optimization improve sell-through and reduce fulfillment costs.
SEO & keyword guidance (brief)
How should retailers prioritize keywords like sneaker sales and US market?
Use primary phrases in high-impact locations: title, intro, H2s, and summary. Combine short-tail terms like "sneaker sales" with long-tail queries such as "sneaker sales trends US online vs in-store" to capture research and transactional intent. Monitor organic traffic uplift after content changes.
What metrics validate content-driven demand generation for sneaker sales?
Track organic sessions, click-through rate, and conversion from content pages, plus assisted conversions from content to DTC. Tie content performance to SKU-level sell-through and new-customer acquisition cost for a holistic ROI view.
Which CTAs should retailers test first?
Prioritize three CTAs: run a regional pilot, invest in analytics for demand forecasting, and launch a limited resale test. Measure lift in conversion, repeat purchases, and margin impact to decide scale-up timing.
How do retailers balance performance footwear and lifestyle product lifecycles?
Manage performance lifecycles via technical storytelling and seasonal participation cycles, while leveraging scarcity, targeted influencer collaborations, and rapid drop cadences to maximize lifestyle/casual segment velocity.


