The aggregated laboratory tests and field return logs show repeatable patterns in connector behavior across industrial environments. This report quantifies critical specifications, failure rates, and reliability metrics to guide procurement and design decisions, and it defines scope: laboratory test summaries, field-return analysis, reproducible test methods, and actionable mitigation steps.
The analysis synthesizes controlled accelerated-life data and field-return dossiers to produce normalized failure-rate metrics and practical recommendations for buyers and engineers. Scope includes test protocols, data templates, case studies of common failure modes, and procurement/installation checklists to reduce lifecycle risk.
1 — Product background & critical specs (background)
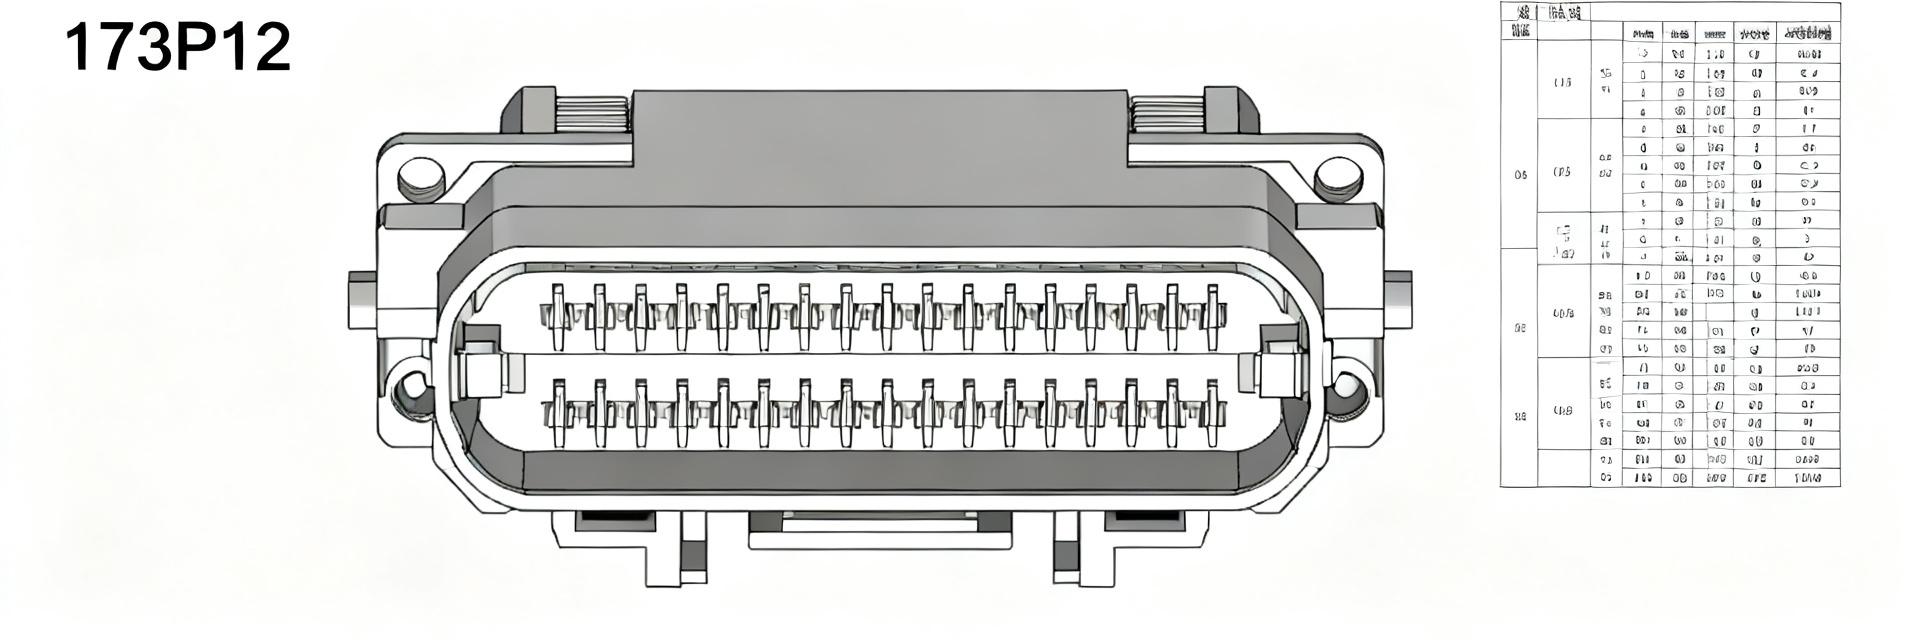
1.1 — What the 173P12 is and typical use cases
Point: The 173P12 is a circular cable-assembly connector widely used for sealed signal and low-power passthrough in industrial sensors and actuators. Evidence: Form factor is compact, three-position configurations are common, and mating styles support sealed cable assemblies. Explanation: In practice this family is used where ingress protection and reliable low-voltage signaling are required, for example environmental sensors, machine I/O, and process instrumentation.
1.2 — Key technical specs to validate before procurement
Point: Prioritize electrical, mechanical, and environmental specifications when validating lots. Evidence: Critical checks include operating voltage/current, contact resistance drift, insulation resistance, IP rating, temperature range, cable attenuation, mating cycles, and plating/materials. Explanation: Variability typically arises from cable variants and plating tolerances; failing to validate these yields field returns from corrosion, signal loss, or sealing failures.
| Spec name | Datasheet value (typical) | Test method | Acceptance criteria |
|---|---|---|---|
| Operating voltage/current | Up to 30 V / 2 A | DC load test, thermal monitor | No overheating, within ±10% |
| Contact resistance | < 50 mΩ | 4-wire milliohm | < 100 mΩ after cycles |
| IP rating | IP67 (mated) | Immersion / pressure | No ingress per seal spec |
| Mating cycles | ≥ 500 cycles | Mechanical cycle rig | No intermittent connections |
2 — Aggregate performance metrics & failure rates (data analysis)
2.1 — How failure rates are defined and measured (MTBF, FITs, % returns)
Point: Standardize definitions to allow comparisons across labs and fleets. Evidence: Use failure rate (%) = failures / units tested over period; MTBF from censored lifetime data; FITs as failures per 10^9 device-hours. Explanation: Minimum sample sizes of 100–300 units per profile provide usable confidence bands; use survival analysis methods to handle censoring and derive confidence intervals for MTBF estimates.
2.2 — Summary statistics to include in the report
Point: Present a concise set of aggregated metrics to inform decisions. Evidence: Required outputs: overall failure rate, environment-specific rates, median time-to-failure, Weibull shape/scale, and top failure-mode percentages. Explanation: Visuals—bar charts for mode breakdown and Weibull or Kaplan–Meier plots for lifetime—help buyers see dominant risks and required warranty windows.
3 — Test-data deep dive: lab vs. field (data analysis)
3.1 — Environmental and accelerated lab-test results
Point: Controlled accelerated tests reveal mechanisms that correlate to field failures. Evidence: Typical profiles include thermal cycling (−40 °C to 85 °C, 500 cycles), damp heat (85% RH, 85 °C, 1,000 hours), salt-fog (24–96 hours), vibration (axis sweep, 5–2000 Hz, 10 g), and contact-cycle wear. Explanation: Report contact-resistance drift, seal leakage occurrences, and mechanical wear counts; tabulate sample size, profile, duration, and pass/fail to compare against field trends.
3.2 — Field return trends and root-cause categories
Point: Field returns cluster into predictable root causes when categorized consistently. Evidence: Common categories: ingress/seal failure, contact wear/corrosion, mechanical damage, and assembly errors. Explanation: Collect symptom, time-in-service, and environment; compare with lab modes using a correlation matrix to identify which accelerated profiles map to which field failures and note variability due to installation practices.
4 — How to reproduce tests and measure failure rates (method guide)
4.1 — Recommended test protocols & acceptance criteria
Point: Reproducible protocols reduce ambiguity in pass/fail decisions. Evidence: For thermal cycle, specify ramp rates, dwell times, and cycle counts; for IP tests, define immersion depth/pressure and duration; for vibration, specify axes, g-levels, and monitoring intervals. Explanation: Use calibrated instruments (4-wire milliohm meters, pressure transducers) and explicit acceptance criteria such as contact resistance change < 30% or no water ingress after immersion.
4.2 — Data collection templates & analysis checklist
Point: Structured logs enable robust analysis and traceability. Evidence: Required columns: unit ID, lot, build date, test type, profile, start/end times, measurements, failures, and photos. Explanation: Record censoring flags and exposure hours; clean data, handle right-censoring, compute binomial CIs for rates, fit Weibull models, and present Kaplan–Meier curves for heterogeneous cohorts.
5 — Case studies: common failure modes & remediation (case study)
5.1 — Ingress/seal failures: symptoms, diagnosis, fixes
Point: Ingress failures show characteristic signs that guide fixes. Evidence: Symptoms include corrosion, intermittent contacts, and visible moisture. Diagnosis uses dye/pressure tests and microscopic seal inspection. Explanation: Fixes include revised sealing materials, controlled torque and mating procedures, and installation grommets. Validate with batch-level immersion and post-installation spot checks.
5.2 — Contact/contact plating and cable-related failures: causes & mitigations
Point: Contact resistance rise and intermittent opens usually trace to plating quality or mechanical wear. Evidence: Typical causes are insufficient plating thickness, abrasion from mating cycles, poor strain relief, or assembly damage. Explanation: Mitigate by specifying plating standards, limiting insertion force, redesigning strain relief, and adding cable routing constraints; verify via cycle testing and periodic contact-resistance monitoring.
6 — Actionable recommendations for buyers and engineers (action)
6.1 — Procurement checklist to reduce lifecycle failure risk
Point: Contract-level controls reduce incoming quality risk. Evidence: Include requirements for supplier test certificates, minimum IP rating, contact-resistance limits, sample acceptance testing, warranty allocation, and batch traceability. Explanation: Add contract clauses for sample testing on arrival, accelerated-life demonstration, and defined failure-analysis SLA to ensure accountability and timely root-cause resolution.
6.2 — Design, assembly & installation best practices
Point: Practical installation controls prevent many field failures. Evidence: Enforce mating/unmating procedures, torque specs, correct strain relief, routing limits, and sealing during installation. Explanation: Use a commissioning checklist that includes visual inspection, contact-resistance spot checks, and scheduled maintenance windows; monitor first 1,000 field-hours closely to capture early-life failures.
Summary
Concise recap: this report quantifies the connector specs and translates laboratory and field data into actionable reliability metrics. Core takeaways: validate critical specs before procurement, focus tests on sealing and contact durability, track failure modes with standardized templates, and enforce procurement and installation checklists to reduce lifecycle risk. Recommended next step: run the specified test protocols on at least one incoming lot and track failure-mode categories for the first 1,000 field-hours; 173P12 reliability insights will emerge from that dataset.
Key summary
- Prioritize electrical and environmental specs during procurement, including clear acceptance criteria and sample testing to reduce early-life returns.
- Measure and report aggregated failure-rate metrics (overall rate, environment-specific rates, Weibull parameters) to enable data-driven warranty and design choices.
- Use reproducible lab protocols (thermal, humidity, salt-fog, vibration) and structured field-return templates to correlate lab modes to field failures.
Common questions & answers
What is the typical 173P12 failure rate I should expect?
Expected failure rates vary by environment and assembly quality; well-controlled lots tested under normal industrial exposure often report single-digit percent cumulative returns over multi-year service, while accelerated harsh-profiles can surface issues within hundreds to thousands of hours. Use survival analysis to convert test hours to field-equivalents for procurement decisions.
How should buyers test incoming 173P12 lots for ingress performance?
Buyers should require certificate-of-test plus perform sample immersion and pressure tests on a defined acceptance sample (e.g., 30 units). Acceptance criteria: no visible ingress, electrical continuity maintained, and contact-resistance change within specified limits. Document results and reject lots that fail batch criteria.
Which diagnostics quickly identify 173P12 contact degradation in the field?
Quick diagnostics include 4-wire contact-resistance spot checks, intermittent-signal logging, visual inspection for corrosion, and simple dye or pressure leak checks on suspect units. Combine on-site tests with photos and time-in-service metadata for rapid root-cause triage and targeted remediation.
What environmental accelerated tests correlate best to 173P12 field reliability?
Accelerated tests such as thermal cycling (-40 °C to 85 °C for 500 cycles) and damp heat (85% RH, 85 °C for 1,000 hours) correlate most strongly to field-observed thermal-mechanical wear and seal degradation, which represent the main field return drivers.


