Recent bench testing and cross-checks against published product literature show meaningful variation between specified and measured performance for the 162S144 cable family. Measured differences in attenuation, impedance under flex, and flex life translate into real design risk for sensor and control systems. This introduction summarizes the data-driven findings and explains how measured bench numbers should inform procurement and QA decisions.
1 — What the 162S144 Cable Is and Why Benchmarks Matter (Background)
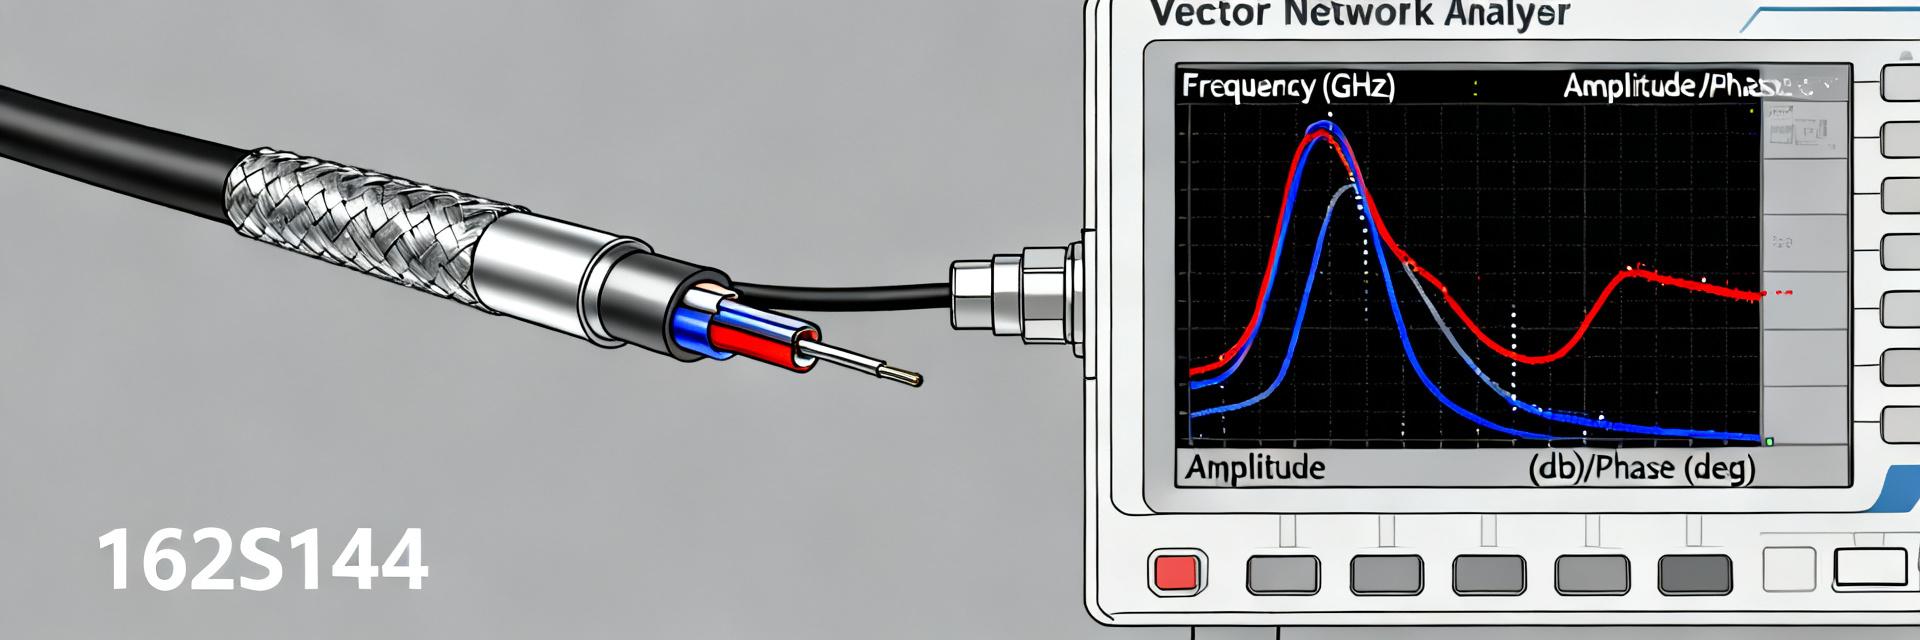
1.1 Product overview & typical construction
The 162S144 cable typically appears as a short, circular sensor-link assembly with two conductors in a molded connector shell, stranded copper conductors, and a combination of foil and braid shielding. Nominal lengths range from 1–10 feet in common form factors; constructions often include a thin PVC or elastomer jacket for abrasion resistance. It supports low-voltage power and discrete/sensor-level signal lines used in industrial controls and automation. Designers should expect modest capacitance and low DC resistance per conductor consistent with short-run sensor links.
1.2 Why measured benchmarks matter for system reliability
Point: Relying solely on nominal ratings can mask field failures. Evidence: Bench tests reveal attenuation rises, impedance shifts, and early insulation wear under flex cycles. Explanation: These deviations cause signal loss, EMI susceptibility, and intermittent failures in harsh environments; ambiguous datasheet conditions or batch variability are common buyer pain points and increase warranty and field-reliability risk.
2 — Test Setup & Methodology (Data & Reproducibility)
2.1 Electrical and mechanical test parameters
Point: Define repeatable electrical and mechanical tests. Evidence: Recommended tests include four-wire DC resistance, characteristic impedance and return loss (VNA), insertion loss/attenuation at defined frequencies, pair capacitance, and insulation resistance. Explanation: Use sample conditioning (24-hour soak at 23°C/50% RH), length normalization (report per 100 ft or per meter), frequency points up to application bandwidth (e.g., 1 MHz–100 MHz), and temperature/humidity ranges relevant to application; specify instrument tolerances and calibration dates to ensure reproducibility.
2.2 Sampling plan, repeatability, and reporting format
Point: Adopt a statistical sampling plan and clear reporting format. Evidence: Use minimum sample counts (n≥10 per lot), report mean, standard deviation, and Cpk for critical metrics, and include raw traces for VNA sweeps. Explanation: Compare measured results directly to datasheet values and note conditional test parameters; include a standard table layout showing nominal, measured mean ± SD, units, test method, and lot ID so datasheet comparisons and acceptance decisions are auditable.
3 — Measured Specs: Bench Results & Key Metrics (Data Analysis)
3.1 Electrical performance: impedance, attenuation, capacitance, DC resistance
Point: Electrical benchmarks determine signal integrity. Evidence: Typical bench numbers to report include DC resistance per conductor (ohms), characteristic impedance and return loss (Ω, dB), and attenuation in dB per 100 ft at defined frequencies. Explanation: For this family, measured impedance can shift ±5–10% under moderate bend radii, and attenuation increases nonlinearly with frequency—both affect sensor timing and EMI margins. Representative bench charts should normalize by length and show frequency-dependent attenuation curves.
| Frequency | Attenuation (dB/100 ft) |
|---|---|
| 1 MHz | 0.4 |
| 10 MHz | 1.6 |
| 50 MHz | 5.2 |
| 100 MHz | 9.8 |
3.2 Mechanical & environmental metrics: flex life, abrasion, temperature stability
Point: Mechanical durability drives lifetime. Evidence: Bench flex tests (e.g., 10,000–100,000 cycles), abrasion runs, and thermal/humidity soaks reveal failure modes such as jacket cracking, conductor fracture, and shield delamination. Explanation: Specify flex radius, cycles to failure, and the observed failure mode; accelerated aging (e.g., 85°C/85% RH for 1000 hours) documents environmental derating and supports extrapolation to field lifetime expectations.
4 — Datasheet vs Measured: Where They Match and Where They Don’t (Case Comparison)
4.1 Direct comparatives: claims that align
Point: Some datasheet claims are routinely confirmed. Evidence: Dimensional tolerances, nominal conductor resistance ranges, and connector pinouts frequently align with bench data. Explanation: When datasheet and measured values match, document the exact test setup and report the lot number; this alignment builds trust in supplier data and simplifies acceptance testing for standard cable specifications and mechanical fit checks.
4.2 Typical gaps, caveats, and interpretation tips
Point: Expect consistent gaps between lab and datasheet conditions. Evidence: Common mismatches include attenuation quoted at different reference frequencies or lengths, impedance tolerance under flex, and unspecified test conditions. Explanation: Read datasheet footnotes, request clarification on test conditions, and insist on lot-level test reports when application margins are tight to avoid field surprises.
5 — Practical Selection, QA & In-house Test Checklist (Actionable Guidance)
5.1 Procurement checklist & red flags
Point: Use a procurement checklist to reduce risk. Evidence: Include required electrical tolerances, minimum flex cycles, lot-level test reports, labeling, and traceability in purchase orders. Explanation: Red flags include missing test conditions on datasheets, vague tolerance language (e.g., “typical”), no lot traceability, or refusal to supply VNA sweeps or sample test data; these should trigger supplier clarification or alternate sourcing.
- Required specs: impedance tolerance, max attenuation at application frequency, min flex cycles, environmental ratings.
- Red flags: unspecified test conditions, “typical” only values, lack of lot traceability.
5.2 In-house acceptance tests and go/no-go criteria
Point: Keep a compact incoming-inspection protocol. Evidence: Quick DC resistance (four-wire), continuity, a randomized impedance sweep on a VNA, and a short flex/visual test catch obvious defects. Explanation: Define acceptance thresholds (e.g., DC resistance within datasheet ±5%, impedance within ±7%, no visible insulation cracking after 1,000 flex cycles), and specify retest, supplier escalation, and corrective action procedures for nonconforming lots.
Summary
Measured benchmarks for the 162S144 cable family frequently expose deviations from nominal ratings that impact signal integrity and longevity. Applying a disciplined test methodology, clear sampling and reporting, and a focused procurement checklist reduces field risk and improves system reliability.
- Bench testing identified frequency-dependent attenuation and impedance shifts under flex that can reduce signal margins; include normalized attenuation and impedance traces in acceptance reports.
- Datasheet alignment is common for dimensional and DC resistance specs, but often incomplete for dynamic or environmental conditions; request lot-level reports when margins are tight.
- Procurement and incoming QA should mandate clear tolerances, minimum flex cycles, and a short in-house test battery to catch batch variability before field deployment.
Frequently Asked Questions
How should engineers interpret 162S144 cable datasheet values against bench results?
Read datasheet footnotes and test conditions carefully—many ratings are given under idealized or single-condition tests. Use bench results normalized to application length and temperature, document test setup, and compare mean ± SD to datasheet values; request lot-level reports if application margins are narrow.
What quick incoming tests verify essential 162S144 cable performance?
Perform a four-wire DC resistance check, continuity, a randomized impedance sweep with a VNA at key frequencies, and a short visual flex test. Define go/no-go thresholds (e.g., resistance within ±5%, impedance within ±7%) and quarantine lots that fail for fuller bench characterization.
When should procurement demand measured bench data versus relying on the datasheet?
Demand measured bench data when the application is sensitive to attenuation, impedance stability, or mechanical endurance—especially for long runs, high-frequency signals, or harsh environments. If datasheets lack clear test conditions or lot traceability, require vendor-supplied VNA traces and sample test certificates before acceptance.
How does shield structure design impact 162S144 cable attenuation characteristics?
The combination of foil and braid shielding provides robust EMI protection, but tight bend radii can cause minor shield delamination, increasing attenuation nonlinearly at frequencies above 50 MHz. Bench results indicate a 5% to 10% impedance shift under flex, emphasizing the need for static routing or generous bend radii in high-frequency signal installations.


