Norway ranks among the highest per‑capita health spenders in Europe, according to recent OECD summaries, driven largely by hospital budgets and high unit costs. This report delivers a clear breakdown of hospital prices and procedure prices, highlights regional and provider variation, and offers actionable takeaways for US payers, employers, and policy teams seeking comparable benchmarks.
1 — Background: Norway’s healthcare system and the roots of cost
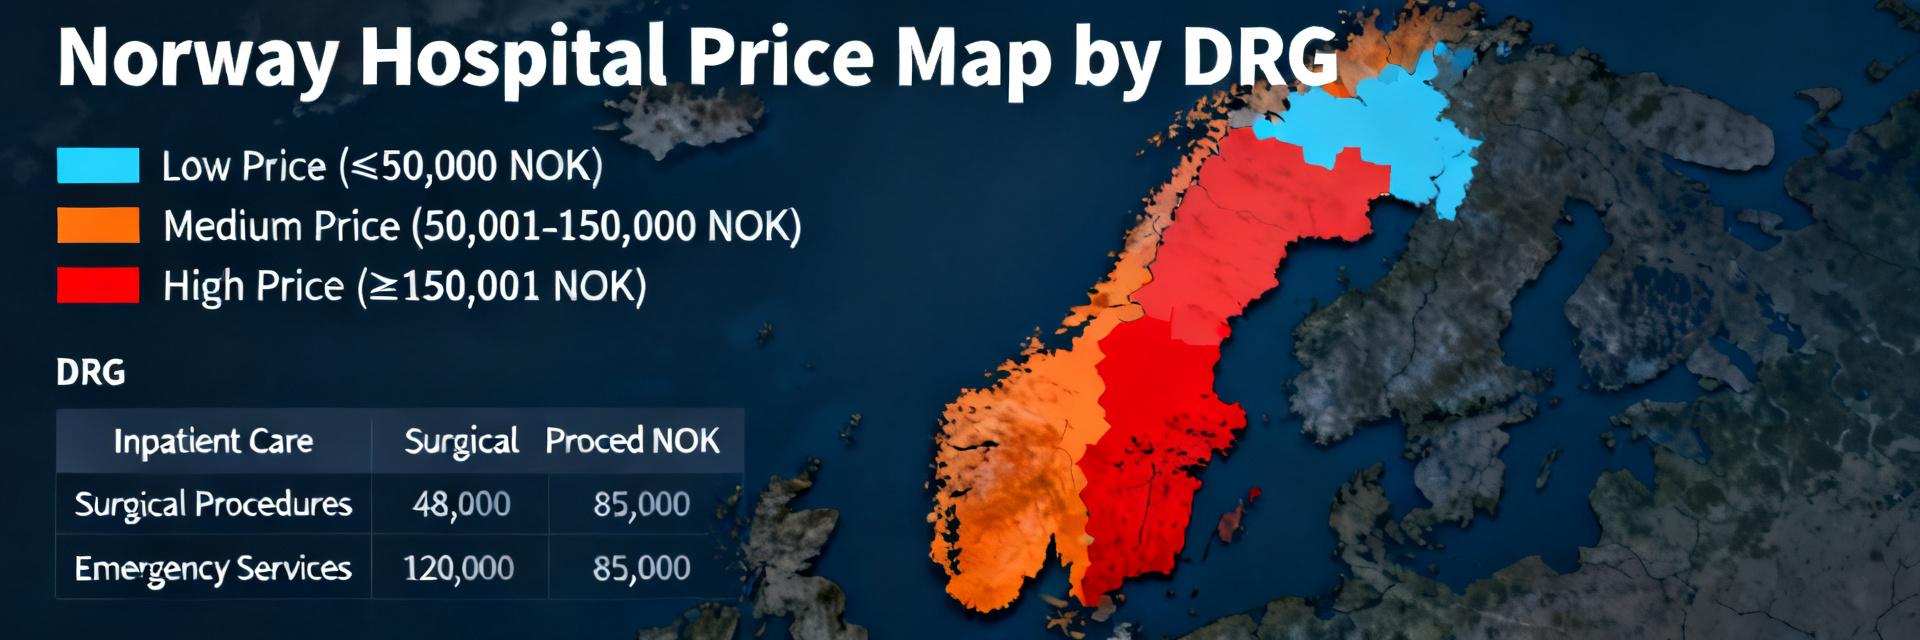
1.1 Funding & coverage model — what pays for care
Point: Norway’s universal coverage is tax financed and administered through state and municipal budgets; Evidence: national policy and OECD descriptions show comprehensive coverage with limited direct billing; Explanation: the public funding pool and central oversight shape pricing incentives and reduce point‑of‑service charges, which influences Norway healthcare costs by concentrating payments through DRG and budget allocations rather than fee‑for‑service.
1.2 Structural cost drivers
Point: Multiple structural factors drive higher unit costs; Evidence: demographic ageing, high health sector wages, dispersed population and rapid tech adoption are repeatedly cited by policy analyses; Explanation: staff wages, patient transport, specialized equipment, and telehealth logistics all inflate hospital price bases—examples include night staffing premiums, air ambulance fees, and implant costs.
- Staffing: premium wages and specialist density.
- Transport: long‑distance transfers and air ambulance usage.
- Technology: implantable devices and advanced imaging.
2 — National data snapshot: hospital prices and spending trends
2.1 Per‑capita spend, hospital budgets, and trend lines
Point: Hospital budgets account for the majority of health spending; Evidence: recent national accounts and OECD indicators show hospitals representing a dominant share of public health expenditure; Explanation: higher per‑capita allocations translate to greater negotiated hospital prices and larger DRG budgets, making hospital prices a central lever for national cost control and cross‑system comparisons.
2.2 What composes hospital prices (admission, bed‑day, DRG tariffs)
Point: Hospital prices aggregate DRG tariffs, bed‑day rates, diagnostics and ancillary fees; Evidence: Norway’s tariff schedules and DRG framework allocate weighted payments per case mix; Explanation: typical hospital prices therefore vary by case complexity, length of stay and diagnostics intensity—expect relative ranges rather than single fixed fees across regions and providers.
3 — Procedure prices: ranges for common procedures
3.1 Elective procedures (examples & price bands)
Point: Elective procedure prices reflect implants, OR time and stay; Evidence: benchmarking studies and tariff summaries place hip replacement, knee arthroscopy and cataract surgery into distinct price bands; Explanation: procedure prices vary with implant cost and length of stay — hip replacements carry higher total costs due to prostheses and longer postop monitoring compared with day‑case cataract surgery.
| Procedure Category | Relative Price Range | Primary Cost Components | Inpatient/Day Case Ratio |
|---|---|---|---|
| Hip Replacement | Highest Band | Implant/Prosthesis, Operating Suite, Post-Op Care | Predominantly Inpatient |
| Knee Arthroscopy | Moderate Band | Endoscopic Equipment, Outpatient Anesthesia | Day Case Standard |
| Cataract Surgery | Lowest Band | Intraocular Lens, Ophthalmic Microscope Time | Strict Day Case |
3.2 Acute and outpatient procedure pricing trends
Point: A shift toward outpatient and day‑case care lowers average per‑procedure spending; Evidence: policy trends and hospital planning documents show deliberate movement to ambulatory models; Explanation: emergency and acute procedures retain higher resource intensity and transfer costs, but expanding day‑case capacity reduces average procedure prices for common interventions.
4 — Regional and provider variation: who charges what and why
4.1 Geographic differences and municipal effects
Point: Prices and access differ by region, with rural and remote areas costing more per case; Evidence: geographic analyses and municipal finance reports indicate transport and staffing differentials; Explanation: smaller regional hospitals face higher per‑patient fixed costs and transfer burdens, pushing up local hospital prices compared with urban centers with higher throughput.
4.2 Public vs private provider pricing & negotiation levers
Point: Public hospitals follow central tariffs while private providers negotiate supplemental rates; Evidence: national DRG systems set baseline payments and procurement guides control device costs; Explanation: payers can use bundled payments, DRG adjustments and procurement leverage to reduce variation—tracking price per DRG and average length of stay are practical monitoring levers.
5 — Comparative insights: Norway vs other high‑income systems
5.1 Cost vs outcomes — value perspective
Point: Higher spending often accompanies strong outcomes; Evidence: international outcome metrics and OECD comparisons show Norway scoring well on many health outcomes; Explanation: Norway’s elevated hospital prices fund timely access, staffing intensity and technology, producing favorable indicators but requiring careful value assessment versus cost.
5.2 Lessons for US payers, employers, and policy teams
Point: Elements of Norway’s model translate to US settings with adaptation; Evidence: successful Norwegian practices include centralized tariffs and strong primary care coordination; Explanation: US actors can pilot tariff mapping and strengthen primary care referral management, but must account for different financing structures and geography when scaling approaches.
6 — Practical recommendations & next steps
6.1 For US payers and employers: what to monitor and pilot
Point: Start with targeted benchmarking and pilots; Evidence: experience shows small pilots identifying large savings; Explanation: recommended actions include benchmarking comparable procedure prices, piloting bundled payments for high‑volume procedures, monitoring DRG‑level variation, and tying contracting incentives to readmission and outcome KPIs.
6.2 Data collection and reporting checklist for an actionable price comparison
Point: A disciplined data checklist enables valid comparisons; Evidence: cross‑country benchmarking protocols emphasize standard definitions and adjustments; Explanation: collect DRG mapping, case mix indexes, PPP or currency adjustments, and standardized outcome metrics, then run a 90‑day benchmarking pilot to inform contracting or benefit design changes.
Summary
Norway’s hospital and procedure pricing reflects a high‑spend, quality‑focused system shaped by public funding, DRG tariffs, labour and geography; this constellation drives Norway healthcare costs but delivers strong outcomes. For US stakeholders, three practical next steps are benchmarking DRG‑level prices, piloting bundled payments for elective procedures, and tracking regional variation to unlock savings while protecting quality.
Key Summary
- Benchmark DRG and procedure prices: map Norway hospital price structure to local equivalents and adjust for case mix and PPP before direct comparisons.
- Pilot payment reforms: test bundled payments and outcome‑linked contracts for hip and cataract procedures to reduce variation and align incentives.
- Track targeted KPIs: monitor price per procedure, readmission rates and average length of stay to detect pricing opportunities and quality tradeoffs.
Frequently Asked Questions
How do Norway healthcare costs compare to other high‑income countries?
Norway typically reports higher per‑capita spending among peers, with hospitals consuming a large share of budgets; international metrics show strong health outcomes in exchange for elevated unit costs, suggesting a tradeoff between expenditure intensity and population health results when assessing value.
What drives variation in hospital prices across Norway?
Variation stems from geography, hospital scale, staffing costs and device procurement: remote hospitals carry higher fixed and transport costs, smaller volumes raise per‑patient overhead, and implant or imaging usage drives price differences even within the same DRG categories.
What immediate actions should a US payer take to use these insights?
Begin with a 90‑day benchmarking project: gather DRG‑level prices, adjust for case mix and PPP, compare against local networks, and pilot bundled payments for high‑volume elective procedures while tracking outcome KPIs to protect quality during price negotiation.
How does Norway's DRG system handle high-cost medical implants and technologies?
Norway integrates high-cost medical implants and specialized technologies directly into standard Diagnosis-Related Group (DRG) allocations. Centralized national procurement processes establish fixed pricing baselines, ensuring high technology adoption without introducing unpredictable provider-level surcharges.


